
Industry Insights · The Pulse
The grosses, read like a P&L.
Every Tuesday: the Broadway box office for people who invest in it. Gross, price, capacity and what they mean for recoupment, with one hidden mechanic of the business each week.
How we compute every number: our methodology. The weekly deep dives are in Investing Unpacked.
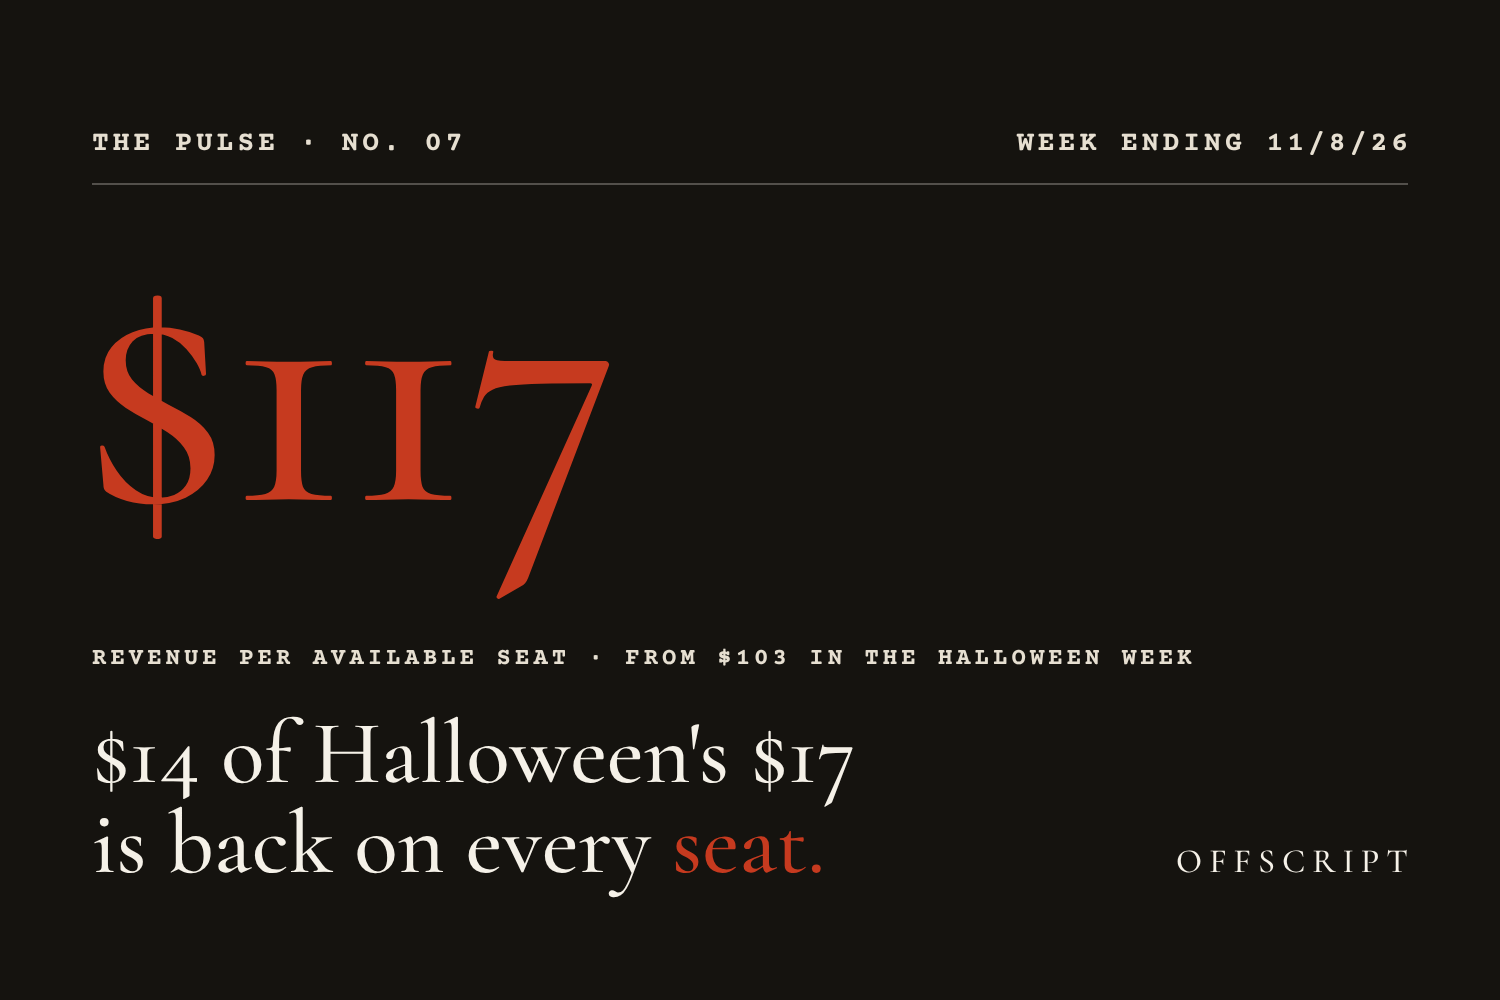
$14 of Halloween’s $17 is back on every seat
Week ending November 8, 2026. Broadway took $36.8M across 35 shows, 24% above the Halloween week, and revenue per available seat went from $103.10 to $117.00. The running shows did it on price first, and the bottom of the table refilled first.
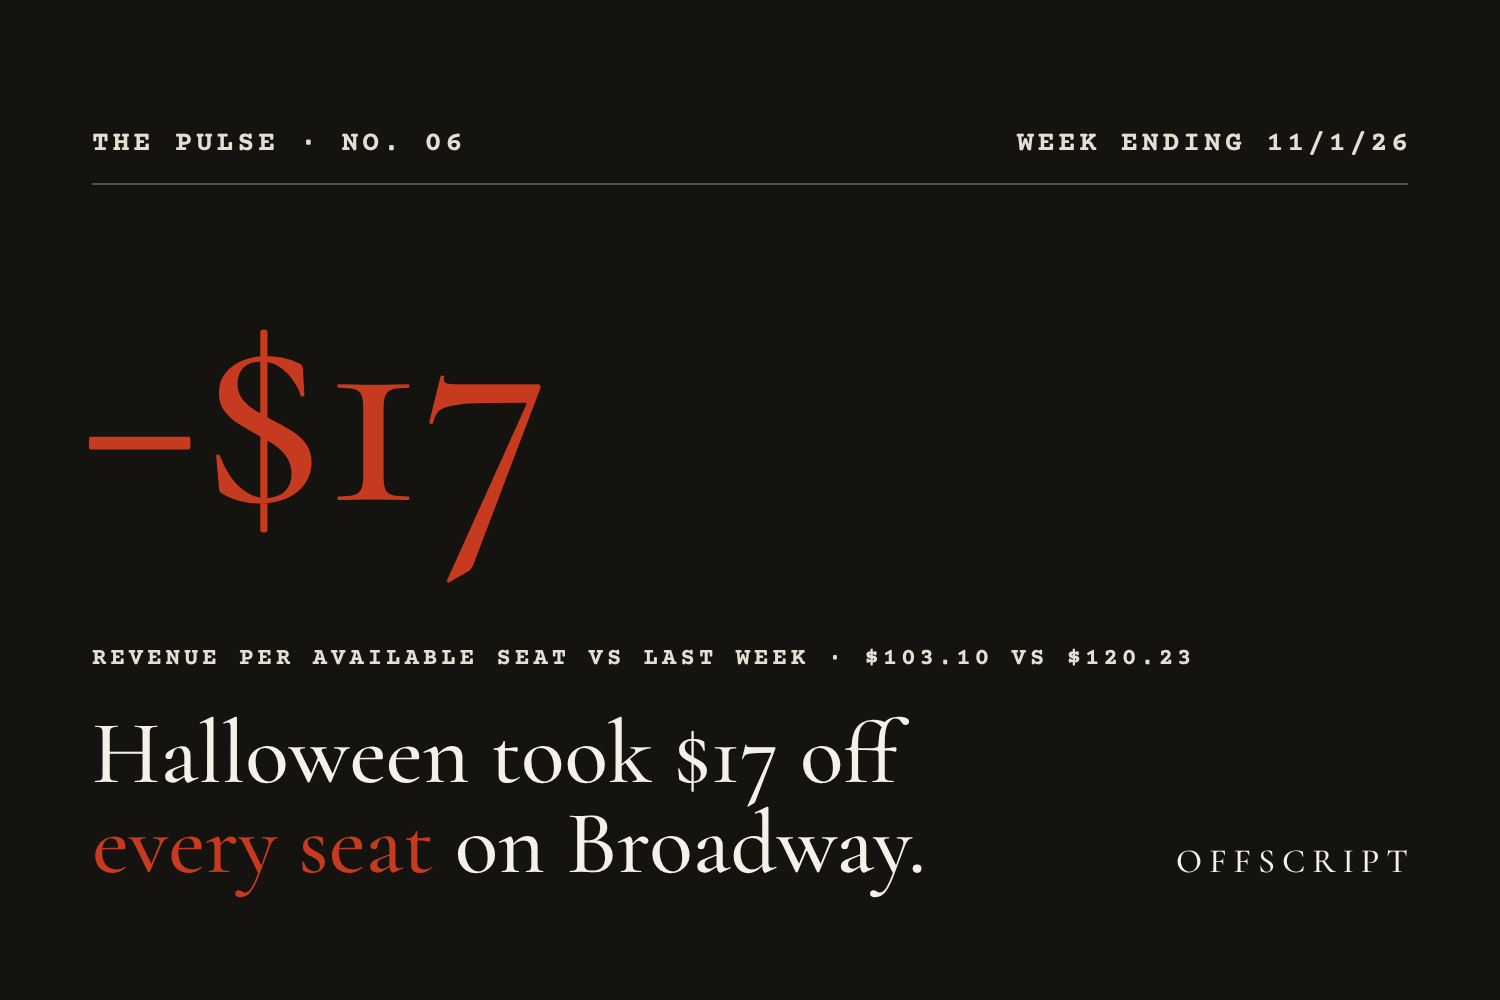
Halloween took $17 off every seat on Broadway
Week ending November 1, 2026. Halloween took $17 off every seat on Broadway: the street grossed $29.6M across 33 shows, 13% below the week before, and revenue per available seat fell to $103.10 from $120.23. Two-thirds of what the running shows lost came off the price, not the seats.
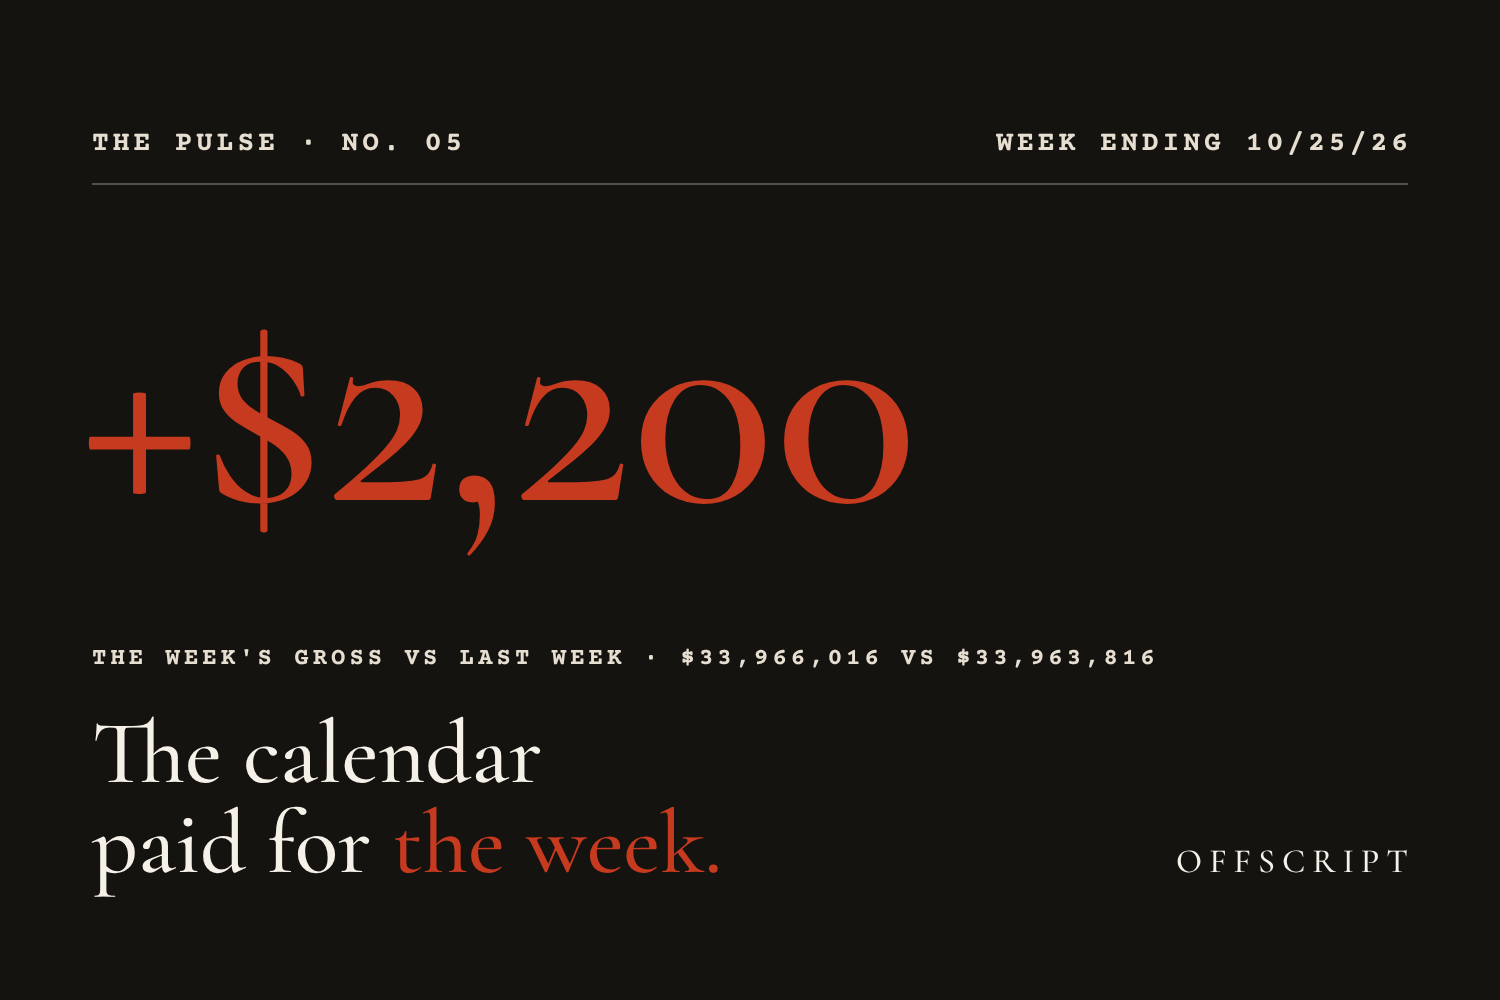
The calendar paid for the week
Week ending October 25, 2026. Broadway grossed $34.0M, $2,200 more than last week, and the flat number hides a trade: two first weeks and two shows adding performances brought $817K more, while the 28 shows at the same performance count brought $815K less and revenue per available seat fell $4 to $120.23.
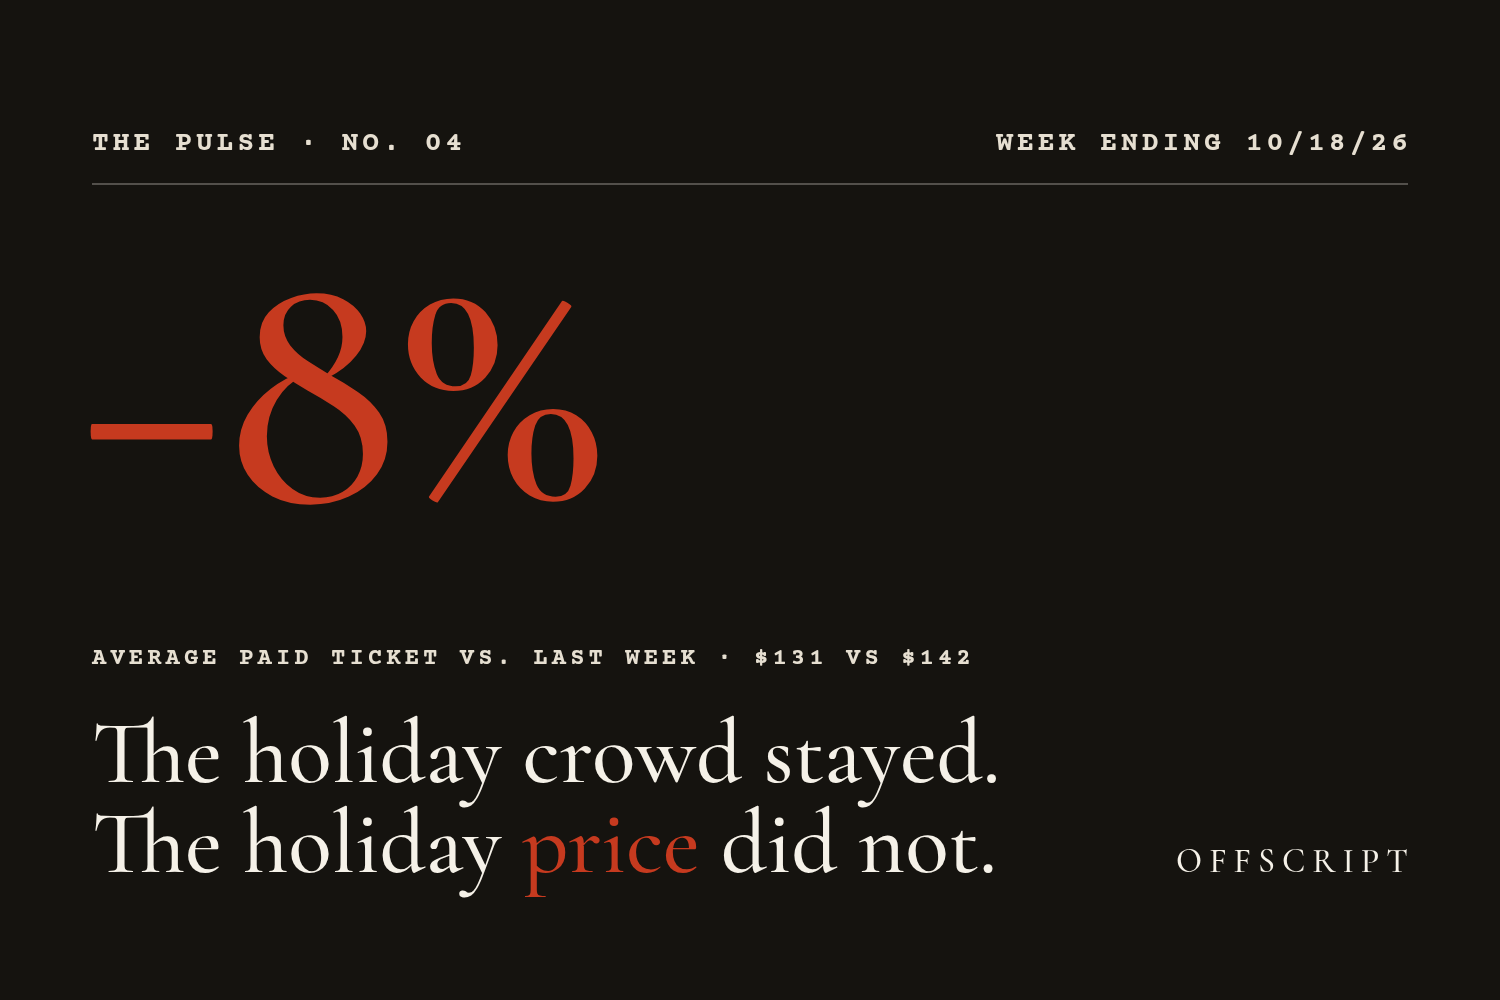
The holiday crowd stayed. The holiday price did not
Week ending October 18, 2026. Broadway took $34.0M as attendance rose 4% and the houses stayed 94.8% full, but the average paid ticket fell $11 to $131.05. The holiday crowd stayed; the holiday premium came off the top of the price ladder.
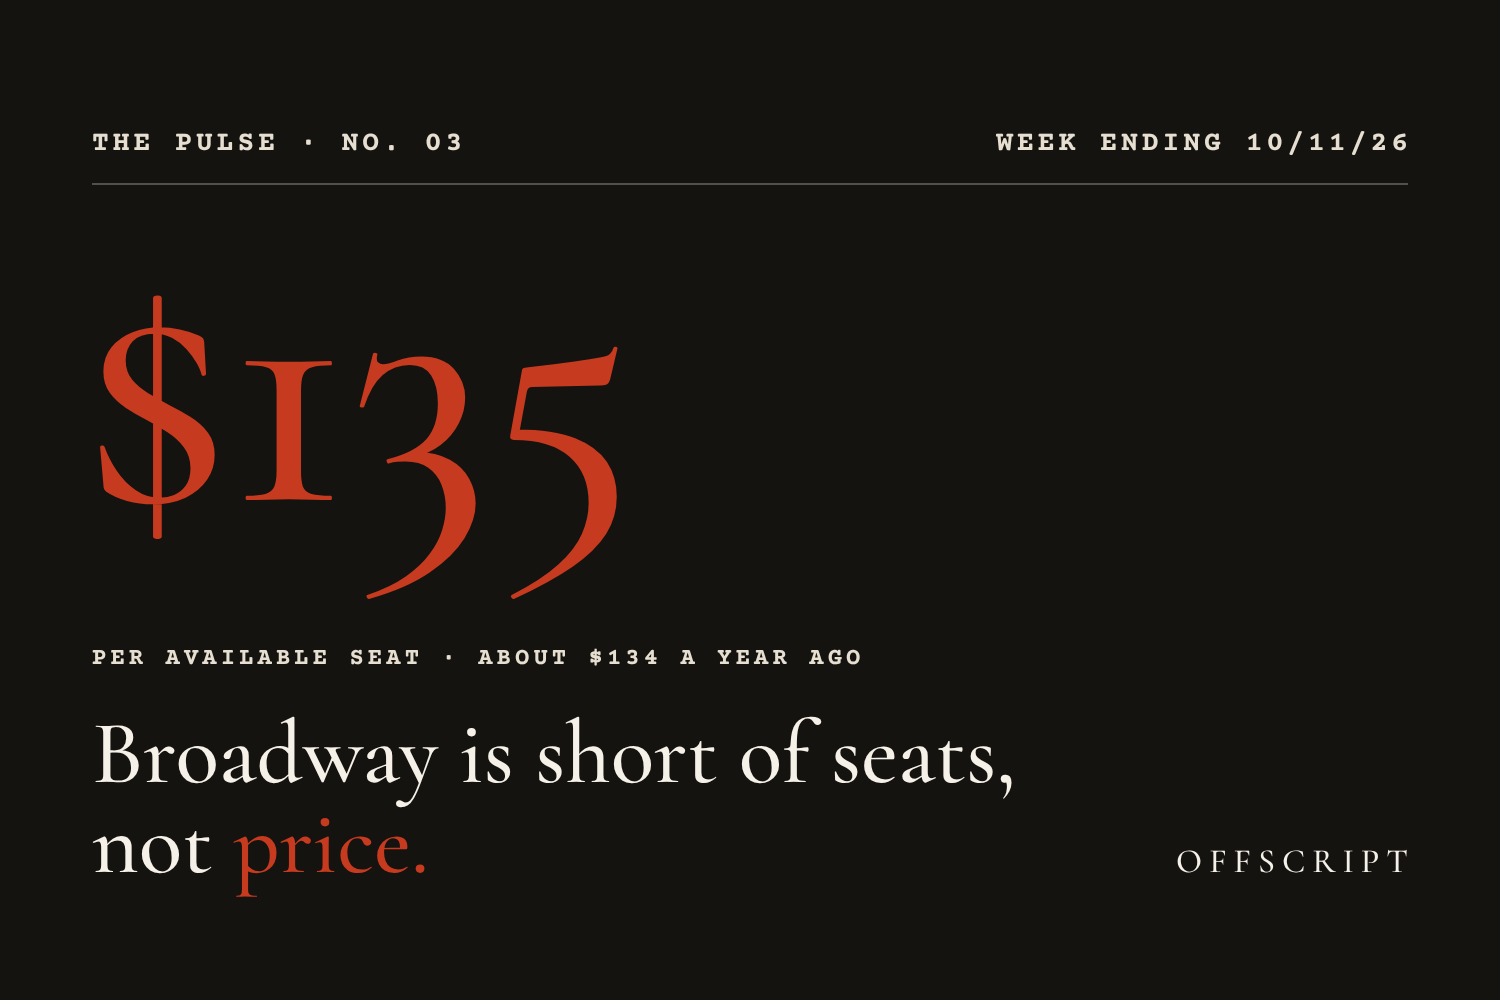
Broadway is short of seats, not price
Week ending October 11, 2026. Columbus Day week took Broadway to $35.3M, and revenue per available seat rose to $134.84, about where last year’s holiday week sat. The gross is still 10% below last year’s because about 11% fewer seats were on sale.
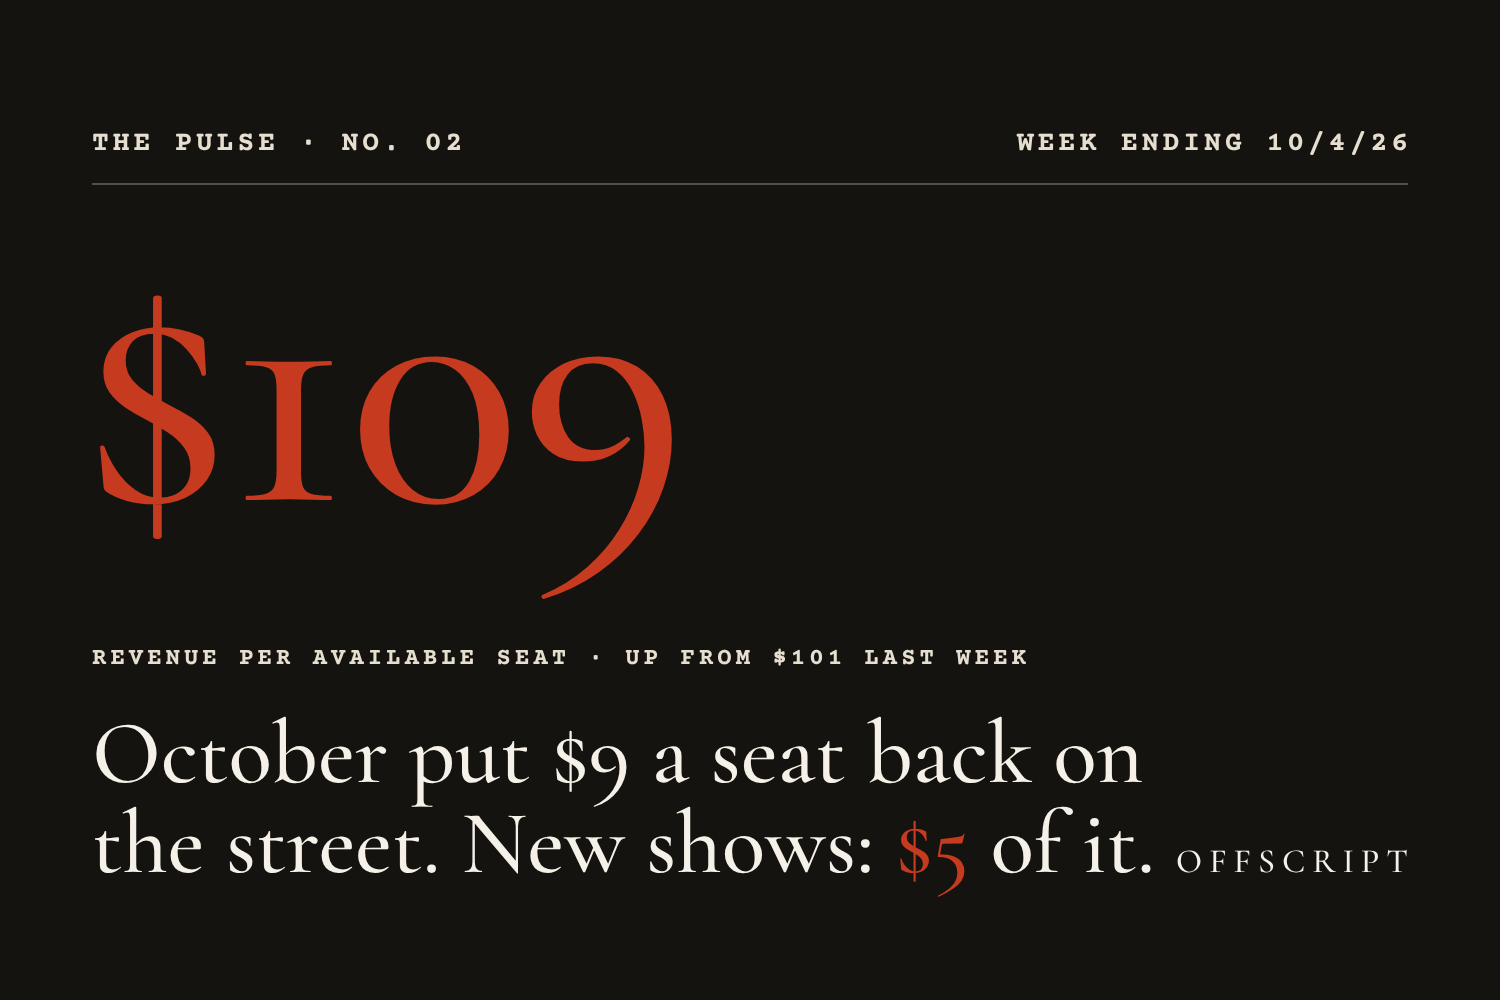
October put $9 a seat back on the street, and two new shows brought $5 of it
Week ending October 4, 2026. Broadway took $27.7M across 28 shows and the street went from $101 to $109 per available seat. Two first weeks brought $5 of the $9; the shows already running added $3 on more people, not higher prices.

Broadway is holding seats by giving up yield
Week ending September 27, 2026. Broadway took $24.1M, down 22% on last year. Per show, attendance is down 4%; the average paid ticket is down 13%. The market is filling seats by giving up yield, and yield is what recoups a show.
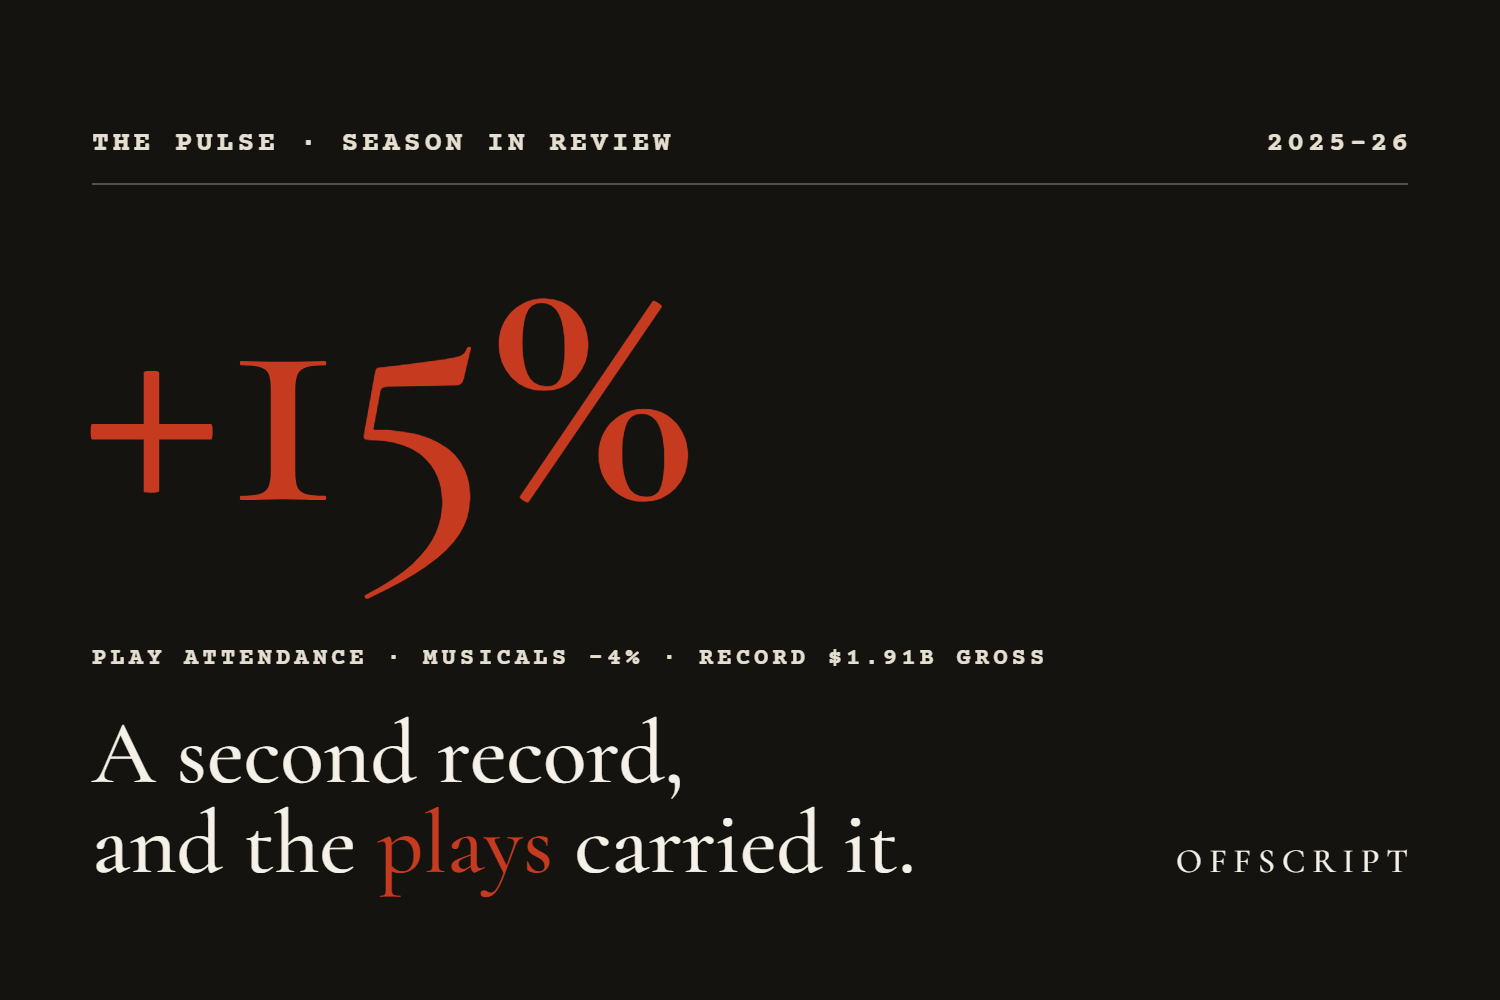
Broadway 2025–26 in review: a second record, and the plays carried it
Season in review, 2025–26. Broadway grossed a record $1.91B in one fewer week. Plays drew 15% more people while musicals drew 4% fewer, Every Brilliant Thing paid back in two months, and Schmigadoon! won Best Musical.
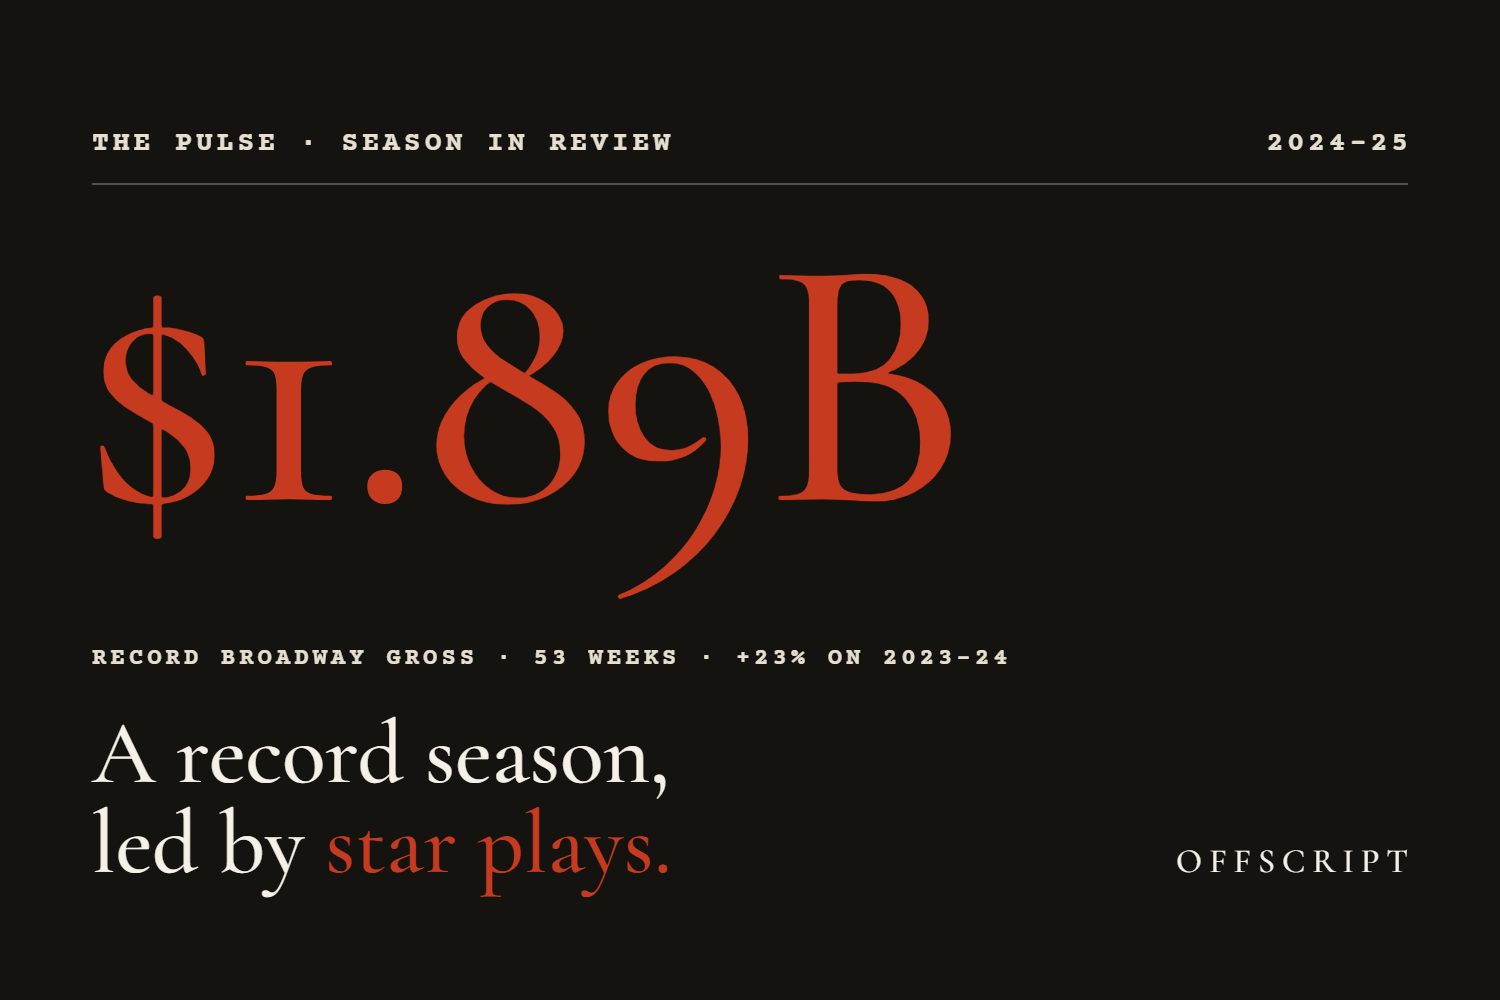
Broadway 2024–25 in review: a record season, led by star plays
Season in review, 2024–25. Broadway grossed a record $1.89B on 14.7M admissions, most of the gain from more shows playing more weeks. Star plays topped the chart, and Wicked's film sent the stage show to a $5M week.
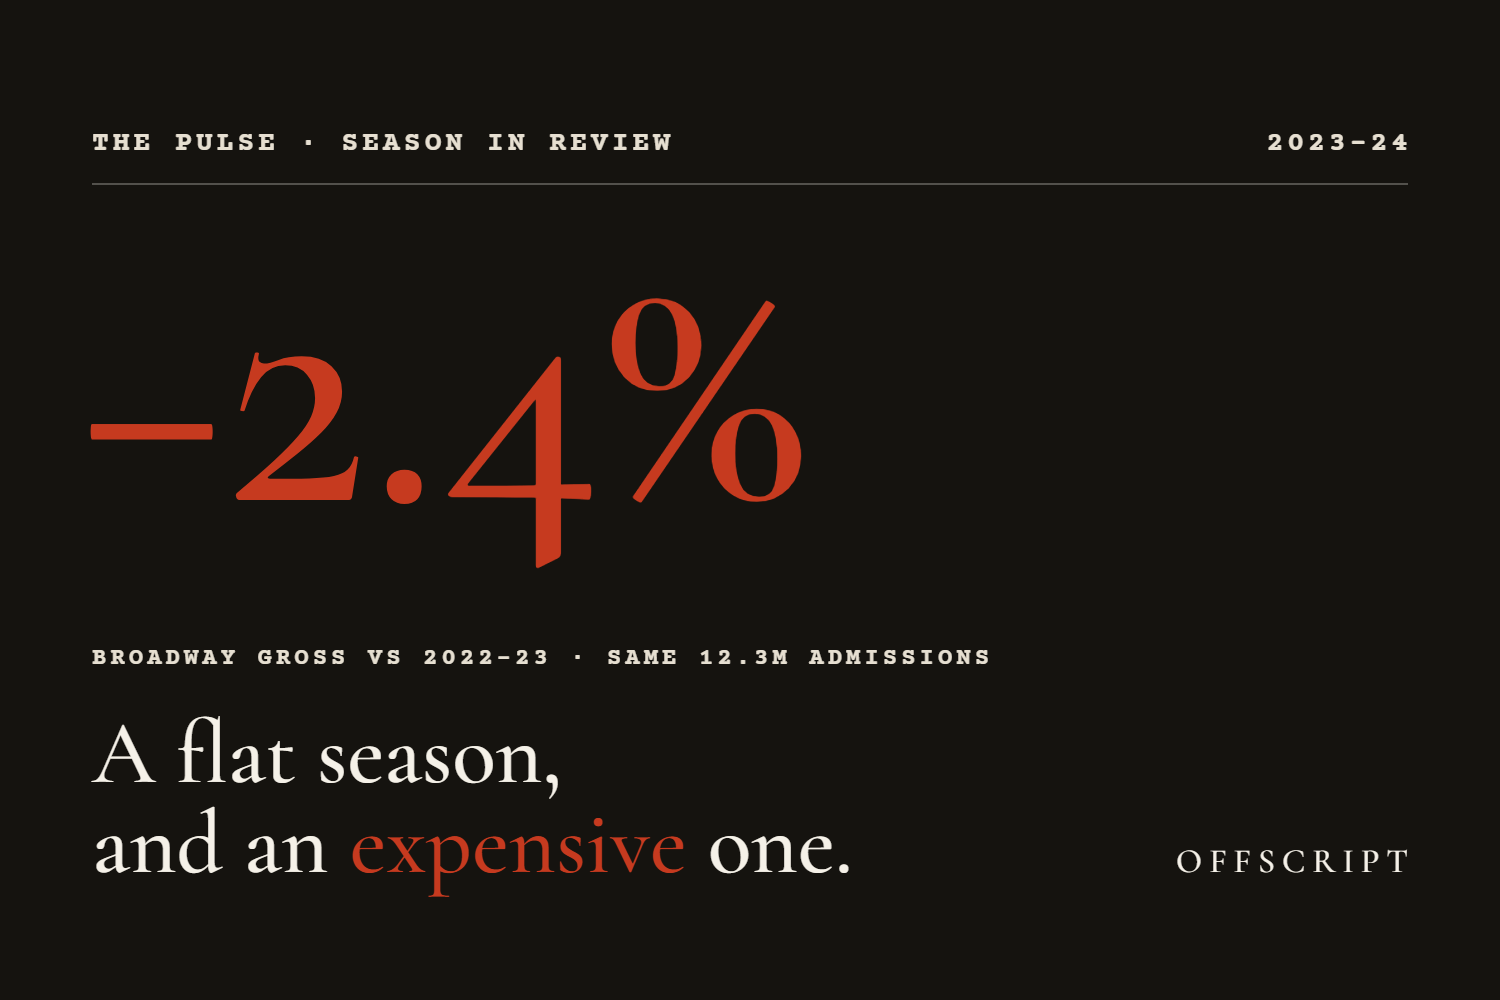
Broadway 2023–24 in review: a flat season and an expensive one
Season in review, 2023–24. Broadway grossed $1.54B, down 2.4%, on the same 12.3M admissions. Five new musicals closed within months, Merrily paid back, and The Outsiders won Best Musical.
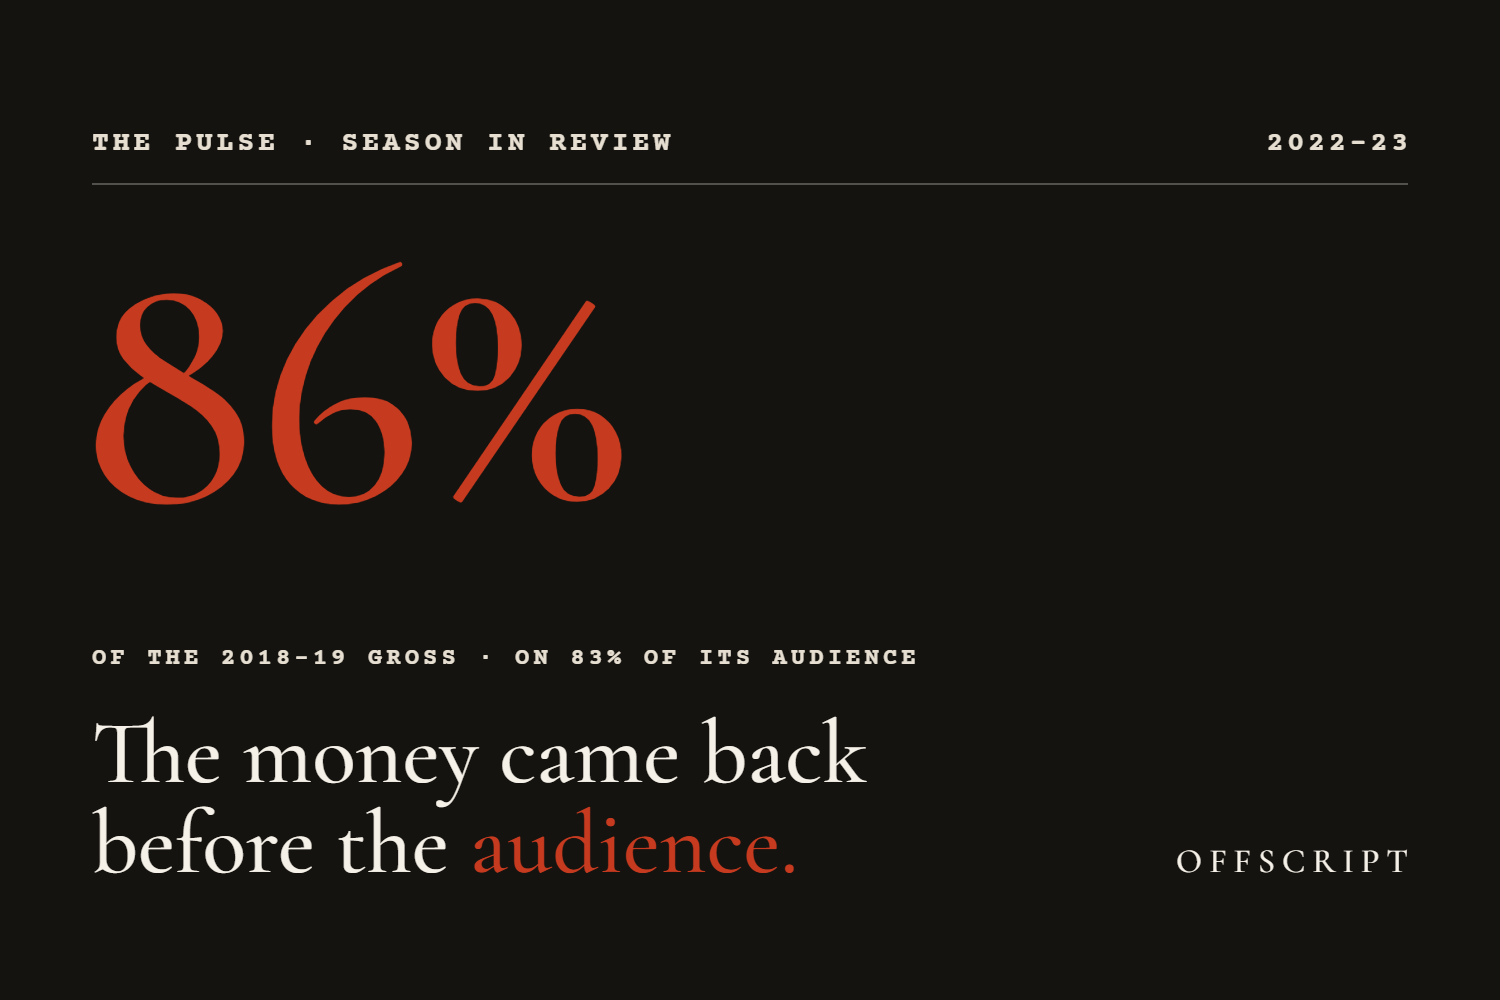
Broadway 2022–23 in review: the money came back before the audience did
Season in review, 2022–23. The first full season after the shutdown grossed $1.58B, 86% of the 2018–19 record, on 83% of its audience. Phantom closed, Kimberly Akimbo won, and price carried the recovery.